1+1=10

记记笔记,放松一下...

PyVista使用小记(二)

接前面PyVista使用小记(一),继续了解PyVista 的基本用法。

PyVista 支持的 Filter

不同的数据集支持不同的Filter,考虑如下数据集:

  • Dataset:所有数据类型的基类
  • PolyData:适合表示表面网格
  • UnstructuredGrid:适合表示体网格
  • ImageData:适合表示规则网格数据
  • Composite:用于组织多个数据集

简单列一下

基础几何处理 Filters

Filter名称 Dataset PolyData UnstructuredGrid ImageData Composite 用途描述
clip 使用平面或函数切割模型
slice 创建截面,可支持多平面切割
threshold 基于标量数值范围筛选数据
extract_edges × × × × 提取模型边缘线框
decimate × × × × 简化网格,减少面数
smooth × × × × 平滑网格表面
compute_normals × × × 计算表面法向量

模型生成 Filters

Filter名称 Dataset PolyData UnstructuredGrid ImageData Composite 用途描述
extrude × × × × 将 2D 形状沿方向向量拉伸成 3D
ribbon × × × × 将线段转换为带状几何体
tube × × × × 将线段转换为管状几何体
delaunay_2d × × × × 从点云生成 2D 三角网格
delaunay_3d × × × 从点云生成 3D 四面体网格
reconstruct_surface × × × × 从点云重建 3D 表面

布尔操作 Filters

Filter名称 Dataset PolyData UnstructuredGrid ImageData Composite 用途描述
boolean_difference × × × × 计算两几何体的差集
boolean_intersection × × × × 计算两几何体的交集
boolean_union × × × × 计算两几何体的并集
merge × × 合并多个几何体,不移除重叠部分

数据处理 Filters

Filter名称 Dataset PolyData UnstructuredGrid ImageData Composite 用途描述
cell_centers × 计算网格单元的中心点
compute_gradient × 计算标量场的梯度
contour × 生成等值线/等值面
sample × 在指定点位置采样数据
probe × 使用一个数据集探测另一个数据集

变换 Filters

Filter名称 Dataset PolyData UnstructuredGrid ImageData Composite 用途描述
translate 对几何体进行平移变换
rotate 对几何体进行旋转变换
scale 对几何体进行缩放变换
transform 使用 4x4 矩阵进行线性变换

特殊用途 Filters

Filter名称 Dataset PolyData UnstructuredGrid ImageData Composite 用途描述
warp_by_scalar × 根据标量场对几何体进行变形
warp_by_vector × 根据向量场对几何体进行变形
streamlines × × 生成流线用于可视化矢量场
extract_surface × × 提取体数据的表面

简单例子

几个简单例子

Extrude(挤压、拉伸)

1
PolyDataFilters.extrude(vector, capping=None, inplace=False, progress_bar=False)

其中:

  • vector:Direction and length to extrude the mesh in.
  • capping:Control if the sweep of a 2D object is capped. The default is False, which differs from VTK’s default.

例子:
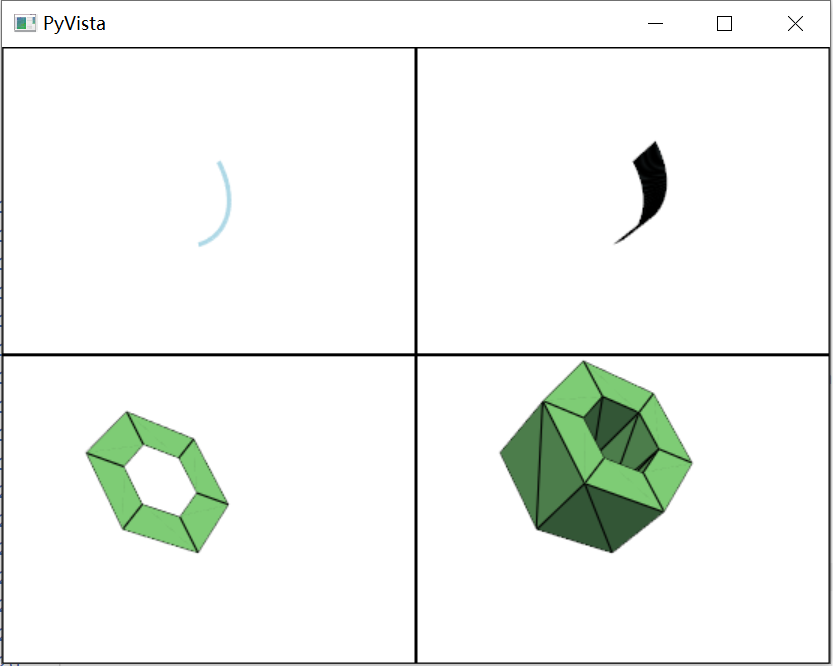
extrude

  • 曲线拉伸成曲面
  • 面拉伸成体
 1
 2
 3
 4
 5
 6
 7
 8
 9
10
11
12
13
14
15
16
17
18
19
20
21
22
23
24
25
26
27
28
29
30
31
32
33
34
35
36
37
38
39
40
41
42
43
import pyvista as pv
import numpy as np

def create_plotter_grid(shape=(2, 2), window_size=(1200, 1200)):
    pl = pv.Plotter(shape=shape, window_size=window_size)
    return pl

def demo_extrudes():
    pl = create_plotter_grid(shape=(2, 2))

    # 圆弧及其拉伸
    arc = pv.CircularArc(center=[0, 0, 0], 
                        pointa=[1, 0, 0], 
                        pointb=[0, 1, 0])
    pl.subplot(0, 0)
    pl.add_mesh(arc, show_edges=True, color='lightblue', line_width=3)

    arc_surface = arc.extrude([0, 0, 0.5], capping=True)
    pl.subplot(0, 1)
    pl.add_mesh(arc_surface, show_edges=True, color='lightblue')

    # 空心圆盘及其拉伸
    hollow_disk = pv.Disc(outer=1, inner=0.5)
    pl.subplot(1, 0)
    pl.add_mesh(hollow_disk, show_edges=True, color='lightgreen')

    hollow_cylinder = hollow_disk.extrude([0, 0, 1], capping=True)
    pl.subplot(1, 1)
    pl.add_mesh(hollow_cylinder, show_edges=True, color='lightgreen')

    # 相机位置
    for i in range(2):
        for j in range(2):
            pl.subplot(i, j)
            pl.camera_position = 'iso'
            pl.camera.zoom(1.2)

    # 显示所有子图
    pl.link_views()
    pl.show()

if __name__ == "__main__":
    demo_extrudes()

Extrude Rotate(拉伸旋转)

 1
 2
 3
 4
 5
 6
 7
 8
 9
10
PolyDataFilters.extrude_rotate(
    resolution=30,
    inplace=False,
    translation=0.0,
    dradius=0.0,
    angle=360.0,
    capping=None,
    rotation_axis=(0, 0, 1),
    progress_bar=False,
)

其中:

  • resolution:Number of pieces to divide line into.
  • translation:Total amount of translation along the axis.
  • dradius:Change in radius during sweep process.
  • angle:The angle of rotation in degrees.
  • capping:Control if the sweep of a 2D object is capped. The default is False, which differs from VTK’s default.

例子:
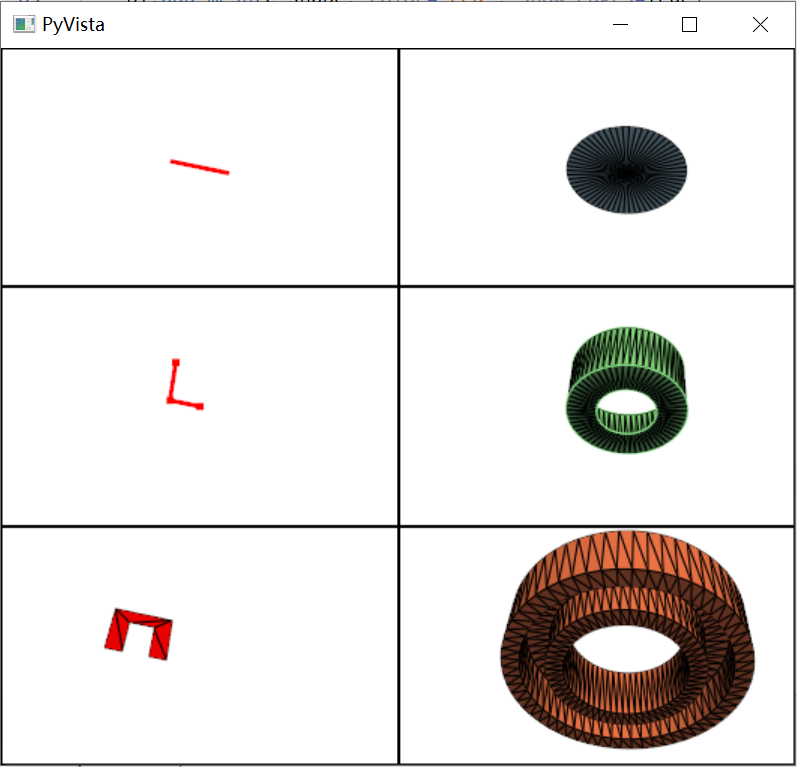
extrude

  • 直线旋转拉伸成圆/圆锥
  • 折线旋转拉伸成体
  • 面旋转拉伸(旋转对称,或者螺旋)
 1
 2
 3
 4
 5
 6
 7
 8
 9
10
11
12
13
14
15
16
17
18
19
20
21
22
23
24
25
26
27
28
29
30
31
32
33
34
35
36
37
38
39
40
41
42
43
44
45
46
47
48
49
50
51
52
53
54
55
56
57
58
59
60
61
62
63
64
65
66
67
68
69
70
71
72
73
74
75
76
77
78
79
80
81
82
83
84
import pyvista as pv
import numpy as np

def create_plotter_grid(shape=(3, 2), window_size=(1200, 1600)):
    pl = pv.Plotter(shape=shape, window_size=window_size)
    return pl

def create_c_shape():
    # 顶点(轴在x=0处,图形在x>0区域,开口朝下)
    points = np.array([
        [1.0, 0, -0.5],  # 0 左下
        [2.0, 0, -0.5],  # 1 右下
        [2.0, 0,  0.5],  # 2 右上
        [1.0, 0,  0.5],  # 3 左上
        # 内部轮廓
        [1.3, 0, -0.5],  # 4 内左下
        [1.7, 0, -0.5],  # 5 内右下
        [1.7, 0,  0.2],  # 6 内右上
        [1.3, 0,  0.2],  # 7 内左上
    ])

    faces = np.array([
        # 左侧竖边
        3, 0, 3, 7,
        3, 0, 7, 4,
        # 上方横边
        3, 3, 2, 6,
        3, 3, 6, 7,
        # 右侧竖边
        3, 2, 1, 5,
        3, 2, 5, 6
    ])

    # 创建PolyData
    poly = pv.PolyData(points, faces)
    return poly

def demo_rotate_extrudes():
    pl = create_plotter_grid(shape=(3, 2))

    # 直线旋转成圆盘
    line = pv.Line([0, 0, 0], [1, 0, 0])
    pl.subplot(0, 0)
    pl.add_mesh(line, color='red', line_width=3)
    disk = line.extrude_rotate(resolution=60)
    pl.subplot(0, 1)
    pl.add_mesh(disk, show_edges=True, color='lightblue')

    # L形线旋转成容器
    points = np.array([
        [0.5, 0, 0],
        [1.0, 0, 0],
        [1.0, 0, 1.0],
    ])
    lines = np.array([3, 0, 1, 2])
    l_shape = pv.PolyData(points)
    l_shape.lines = lines

    pl.subplot(1, 0)
    pl.add_mesh(l_shape, color='red', line_width=3)
    vessel = l_shape.extrude_rotate(resolution=60)
    pl.subplot(1, 1)
    pl.add_mesh(vessel, show_edges=True, color='lightgreen')

    # 开口向下矩形旋转
    c_shape = create_c_shape()
    pl.subplot(2, 0)
    pl.add_mesh(c_shape, color='red', show_edges=True)
    core_body = c_shape.extrude_rotate(resolution=60)
    pl.subplot(2, 1)
    pl.add_mesh(core_body, show_edges=True, color='coral')

    # 相机位置
    for i in range(3):
        for j in range(2):
            pl.subplot(i, j)
            pl.camera_position = 'iso'
            pl.camera.zoom(1.2)

    pl.link_views()
    pl.show()

if __name__ == "__main__":
    demo_rotate_extrudes()

Extrude Trim(拉伸裁剪)

1
2
3
4
5
6
7
8
PolyDataFilters.extrude_trim(
    direction,
    trim_surface,
    extrusion='boundary_edges',
    capping='intersection',
    inplace=False,
    progress_bar=False,
)

其中:

  • direction:Direction vector to extrude.
  • trim_surface:Surface which trims the surface.
  • extrusion:Control the strategy of extrusion. One of the following:
    • "boundary_edges"
    • "all_edges"
  • capping:Control the strategy of capping. One of the following:
    • "intersection"
    • "minimum_distance"
    • "maximum_distance"
    • "average_distance"

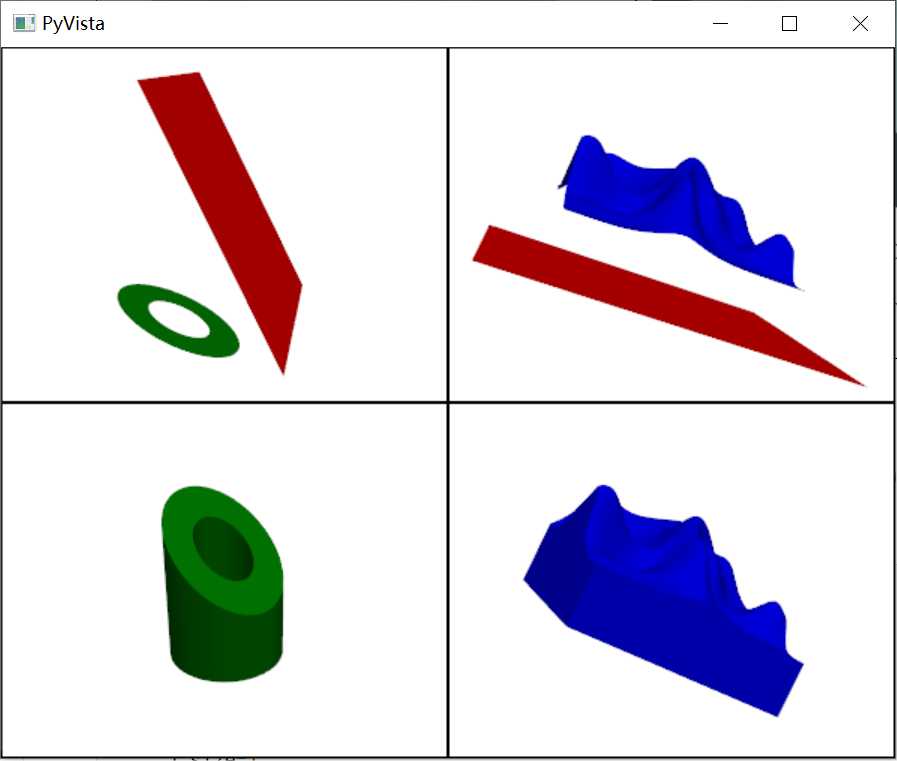
例子:

extrude trim

 1
 2
 3
 4
 5
 6
 7
 8
 9
10
11
12
13
14
15
16
17
18
19
20
21
22
23
24
25
26
27
28
29
30
31
32
33
34
35
36
37
38
39
40
41
42
43
44
45
46
47
48
49
50
51
import pyvista as pv 
import numpy as np

def create_plotter_grid(shape=(2, 2), window_size=(1200, 800)):
    pl = pv.Plotter(shape=shape, window_size=window_size)
    return pl

def demo_extrude_trim():
    pl = create_plotter_grid()

    # Demo1
    pl.subplot(0, 0)
    disc = pv.Disc(center=(0, 0, -1), c_res=50)
    plane = pv.Plane(i_size=2, j_size=2, direction=[0, 0.8, 1])
    pl.add_mesh(disc, color='green')
    pl.add_mesh(plane, color='red')

    pl.subplot(1, 0)
    extruded_disc = disc.extrude_trim([0, 0, 1], plane)
    pl.add_mesh(extruded_disc, color='green')
    #extruded_disc.plot(smooth_shading=True, split_sharp_edges=True)

    # Demo2
    pl.subplot(0, 1)
    hills = pv.ParametricRandomHills(random_seed=2)
    hills_plane = pv.Plane(
    center=(hills.center[0], hills.center[1], -5),
    direction=(0, 0, -1),
    i_size=30,
    j_size=30,
)
    pl.add_mesh(hills_plane, color='red')
    pl.add_mesh(hills, color='blue')

    pl.subplot(1, 1)
    # Perform the extrude trim
    extruded_hills = hills.extrude_trim((0, 0, -1.0), hills_plane)
    pl.add_mesh(extruded_hills, color='blue')

    # 设置视角
    for i in range(2):
        for j in range(2):
            pl.subplot(i, j)
            pl.camera_position = 'iso'  # 视角设置为等距视图
            pl.camera.zoom(1.2)

    #pl.link_views()
    pl.show()

if __name__ == "__main__":
    demo_extrude_trim()

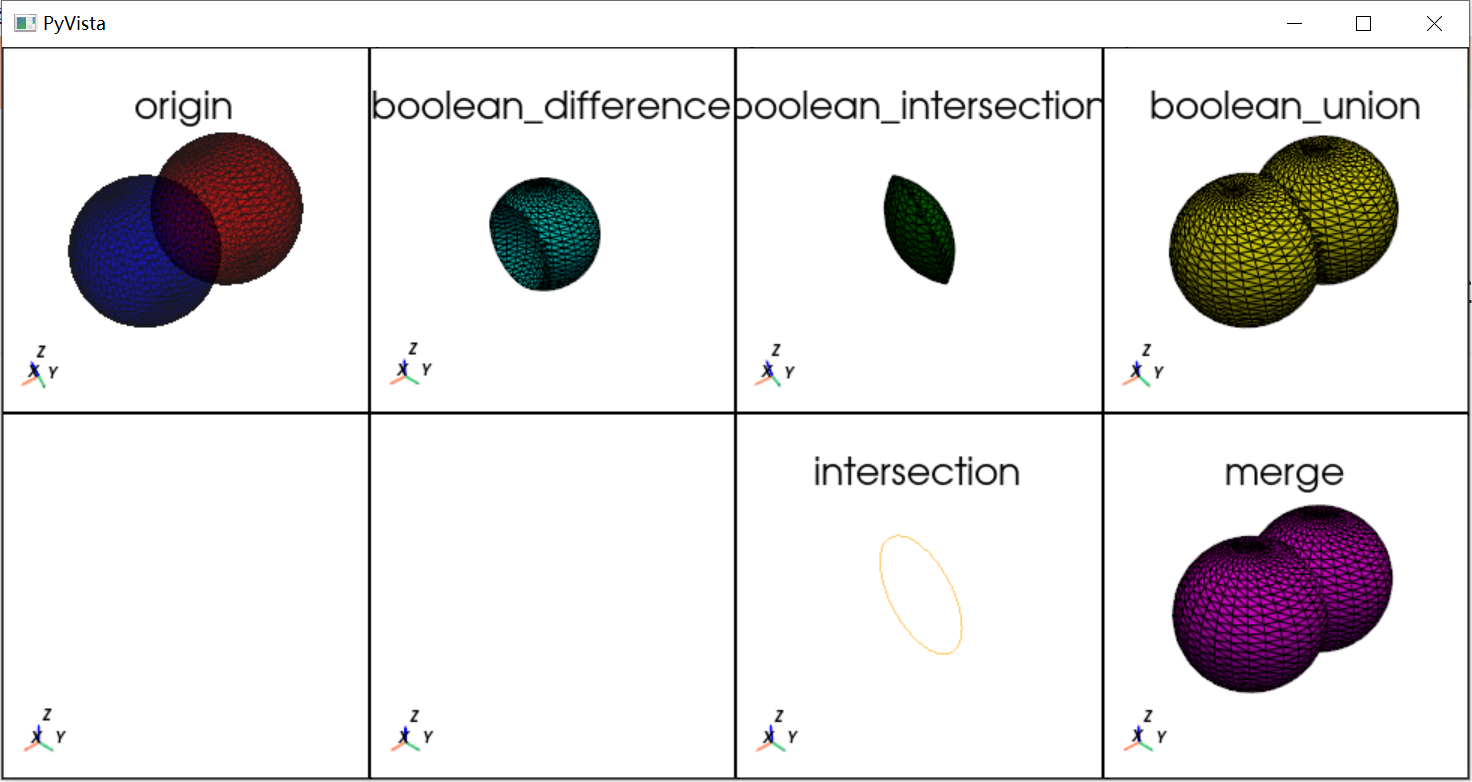
交、差、并

分为布尔操作和普通的操作:

操作类型 描述 结果 示例 使用场景
布尔差集(boolean_difference) 从第一个几何体中去除与第二个几何体相交的部分 返回不相交的部分 由球体1减去与球体2的重叠部分 物体差集,去除交叠部分
布尔交集(boolean_intersection) 返回两个几何体的交叠部分 返回相交的部分 仅返回两个球体的交集部分 提取交集区域
布尔并集(boolean_union) 合并两个几何体,返回它们的并集 返回两个几何体合并后的部分 合并两个球体得到一个新的物体 合并物体,得到完整区域
普通合并(merge) 将两个几何体合并成一个,保留其所有部分 返回包含两个几何体的集合体 直接合并两个球体,包含重叠部分 合并物体为一个大物体,不改变形状
交集(intersection) 返回两个几何体的交叠部分(交集区域) 返回交集区域,通常为PolyData对象 提取两个球体的交集部分 提取交集区域,适用于提取重叠区域

filter

 1
 2
 3
 4
 5
 6
 7
 8
 9
10
11
12
13
14
15
16
17
18
19
20
21
22
23
24
25
26
27
28
29
30
31
32
33
34
35
36
37
38
39
40
41
42
43
44
45
46
47
48
49
50
51
52
53
54
55
56
57
58
59
60
61
62
import pyvista as pv
import numpy as np

def create_plotter_grid(shape=(2, 4), window_size=(1000, 1200)):
    pl = pv.Plotter(shape=shape, window_size=window_size)
    return pl

def demo_sphere_operations():
    pl = create_plotter_grid()

    # 创建两个球体
    s1 = pv.Sphere(center=(-0.3, 0, 0), radius=0.5).triangulate()
    s2 = pv.Sphere(center=(0.3, 0, 0), radius=0.5).triangulate()

    # 原始形状
    pl.subplot(0, 0)
    pl.add_mesh(s1, color='red', opacity=0.7, show_edges=True)
    pl.add_mesh(s2, color='blue', opacity=0.7, show_edges=True)
    pl.add_title("origin", font_size=10)

    # 布尔差集
    pl.subplot(0, 1)
    difference = s1.boolean_difference(s2)
    pl.add_mesh(difference, color='cyan', show_edges=True)
    pl.add_title("boolean_difference", font_size=10)

    # 布尔交集
    pl.subplot(0, 2)
    intersection = s1.boolean_intersection(s2)
    pl.add_mesh(intersection, color='green', show_edges=True)
    pl.add_title("boolean_intersection", font_size=10)

    # 布尔并集
    pl.subplot(0, 3)
    union = s1.boolean_union(s2)
    pl.add_mesh(union, color='yellow', show_edges=True)
    pl.add_title("boolean_union", font_size=10)

    # 交集
    pl.subplot(1, 2)
    intersection_filter, s1_split, s2_split = s1.intersection(s2)
    pl.add_mesh(intersection_filter, color='orange', opacity=0.6, show_edges=True)
    pl.add_title("intersection", font_size=10)

    # 合并
    pl.subplot(1, 3)
    merge = s1.merge(s2)
    pl.add_mesh(merge, color='magenta', show_edges=True)
    pl.add_title("merge", font_size=10)

    # 设置每个子图的视角
    for i in range(2):
        for j in range(4):
            pl.subplot(i, j)
            pl.camera_position = 'iso'
            pl.camera.zoom(1.2)
            pl.add_axes()

    pl.show()

if __name__ == "__main__":
    demo_sphere_operations()

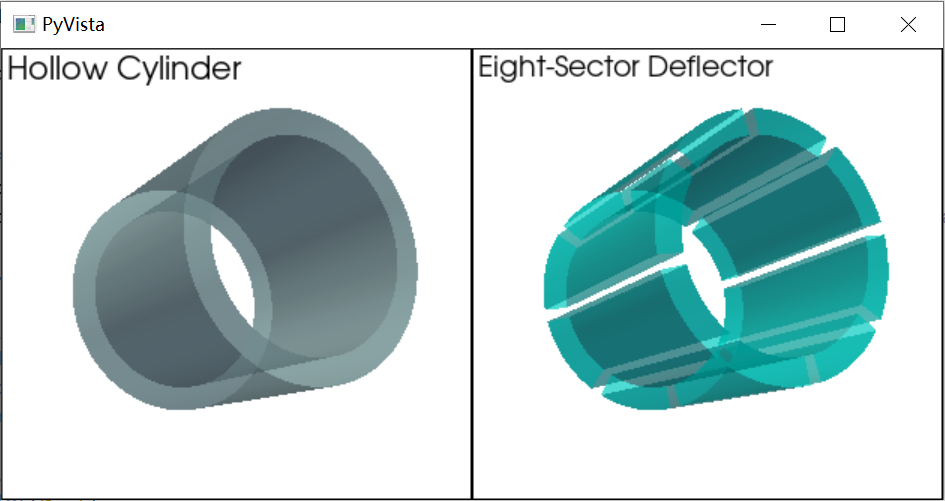
生成8瓣空心圆柱体(一)

有前面的准备,可以做些简单的事情

demo

 1
 2
 3
 4
 5
 6
 7
 8
 9
10
11
12
13
14
15
16
17
18
19
20
21
22
23
24
25
26
27
28
29
30
31
32
33
34
35
36
37
38
39
40
41
42
43
44
45
46
47
48
49
50
51
52
53
54
55
56
57
58
59
60
61
62
63
64
import pyvista as pv
import numpy as np


def create_hollow_cylinder(radius_outer=1, radius_inner=0.8, height=0.5, resolution=360):
    outer_cylinder = pv.Cylinder(center=(0, 0, 0), direction=(0, 0, 1),
                                 radius=radius_outer, height=height, resolution=resolution).triangulate()
    inner_cylinder = pv.Cylinder(center=(0, 0, 0), direction=(0, 0, 1),
                                 radius=radius_inner, height=height*1.1, resolution=resolution).triangulate()
    return outer_cylinder.boolean_difference(inner_cylinder)

def create_eight_sector_deflector(radius_outer=1, radius_inner=0.8, height=0.5, gap=0.1):
    """
    param gap: 扇形之间的间隙角度(以弧度为单位)
    """
    # 创建空心圆筒
    hollow_cylinder = create_hollow_cylinder(radius_outer, radius_inner, height)

    sectors = []
    sector_angle = np.pi / 4

    for i in range(8):
        # 计算当前瓣的起止角度
        start_angle = i * sector_angle
        end_angle = start_angle + sector_angle - gap

        # 切割扇形
        clipped_cylinder = hollow_cylinder.clip(normal=(np.cos(start_angle), np.sin(start_angle), 0),
                                                origin=(0, 0, 0))
        clipped_cylinder = clipped_cylinder.clip(normal=(-np.cos(end_angle), -np.sin(end_angle), 0),
                                                  origin=(0, 0, 0))
        sectors.append(clipped_cylinder)

    # 合并所有扇形
    deflector = sectors[0]
    for sector in sectors[1:]:
        deflector = deflector.merge(sector)

    return deflector


def plot_deflector_with_subplots():
    hollow_cylinder = create_hollow_cylinder(radius_outer=0.5, radius_inner=0.4, height=1)
    deflector = create_eight_sector_deflector(radius_outer=0.5, radius_inner=0.4, height=1, gap=0.1)

    pl = pv.Plotter(shape=(1, 2), border=True)

    # 左侧:空心圆筒
    pl.subplot(0, 0)
    pl.add_text("Hollow Cylinder", position="upper_left", font_size=12)
    pl.add_mesh(hollow_cylinder, color='lightblue', show_edges=False, opacity=0.7)

    # 右侧:八瓣偏转器
    pl.subplot(0, 1)
    pl.add_text("Eight-Sector Deflector", position="upper_left", font_size=12)
    pl.add_mesh(deflector, color='cyan', show_edges=False, opacity=0.7)

    # 显示
    pl.link_views()
    pl.show()


if __name__ == "__main__":
    plot_deflector_with_subplots()

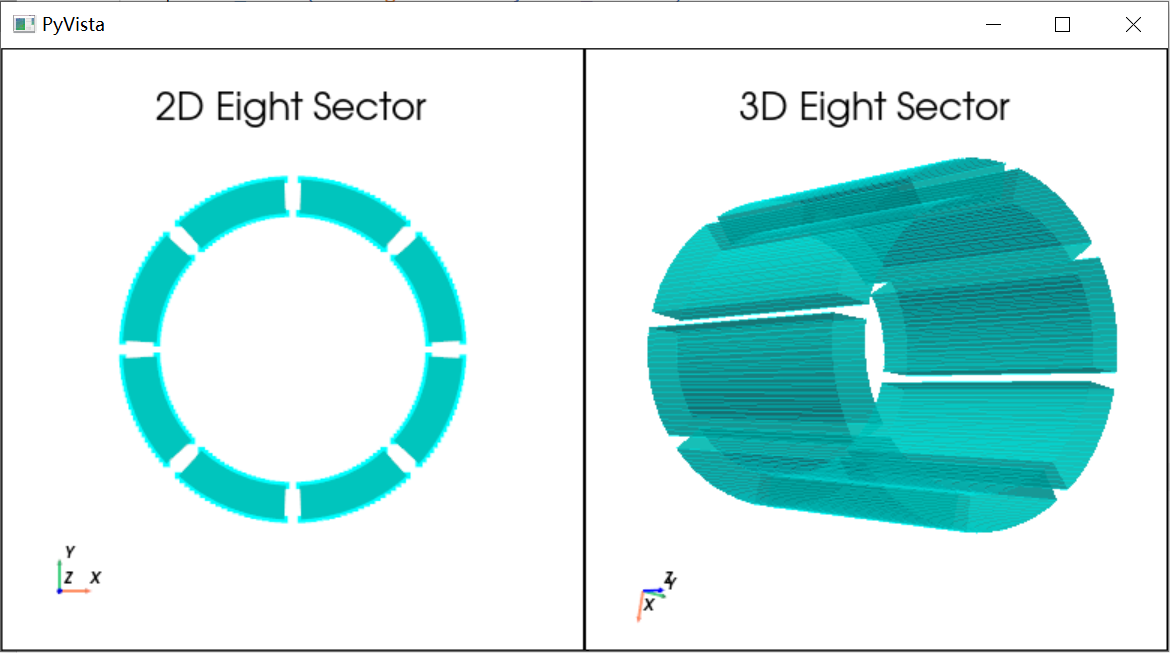
生成8瓣空心圆柱体(二)

换一种方式

demo

  1
  2
  3
  4
  5
  6
  7
  8
  9
 10
 11
 12
 13
 14
 15
 16
 17
 18
 19
 20
 21
 22
 23
 24
 25
 26
 27
 28
 29
 30
 31
 32
 33
 34
 35
 36
 37
 38
 39
 40
 41
 42
 43
 44
 45
 46
 47
 48
 49
 50
 51
 52
 53
 54
 55
 56
 57
 58
 59
 60
 61
 62
 63
 64
 65
 66
 67
 68
 69
 70
 71
 72
 73
 74
 75
 76
 77
 78
 79
 80
 81
 82
 83
 84
 85
 86
 87
 88
 89
 90
 91
 92
 93
 94
 95
 96
 97
 98
 99
100
import pyvista as pv
import numpy as np

def create_arc_points(radius, start_angle, end_angle, n_points=20):
    """
    创建圆弧上的点
    """
    angles = np.linspace(start_angle, end_angle, n_points)
    points = np.zeros((n_points, 3))
    points[:, 0] = radius * np.cos(angles)
    points[:, 1] = radius * np.sin(angles)
    return points

def create_2d_eight_sector(radius_outer=1, radius_inner=0.8, gap=0.1):
    """
    创建二维的八瓣截面,每个扇形是实心的圆环段
    """
    sectors = []
    sector_angle = np.pi / 4  # 45度

    for i in range(8):
        # 计算当前扇形的起止角度
        start_angle = i * sector_angle + gap/2
        end_angle = (i + 1) * sector_angle - gap/2

        # 创建外圆弧和内圆弧的点
        n_points = 20  # 每个圆弧的点数
        outer_arc = create_arc_points(radius_outer, start_angle, end_angle, n_points)
        inner_arc = create_arc_points(radius_inner, start_angle, end_angle, n_points)

        # 组合所有点,按照顺时针顺序排列
        all_points = np.vstack([
            outer_arc,          # 外圆弧点
            inner_arc[::-1]     # 内圆弧点(反转顺序)
        ])

        # 创建面片
        n_points_per_arc = len(outer_arc)
        faces = []

        # 创建一个大面片连接所有点
        n_total_points = len(all_points)
        face = [n_total_points] + list(range(n_total_points))
        faces = np.array(face)

        # 创建扇形
        sector = pv.PolyData(all_points)
        sector.faces = faces
        sectors.append(sector)

    # 合并所有扇形
    eight_sector_2d = sectors[0]
    for sector in sectors[1:]:
        eight_sector_2d = eight_sector_2d.merge(sector)

    return eight_sector_2d

def create_3d_eight_sector_deflector(radius_outer=1, radius_inner=0.8, height=0.5, gap=0.1):
    # 创建2D底面
    bottom = create_2d_eight_sector(radius_outer, radius_inner, gap)

    # 拉伸
    vectors = np.array([[0, 0, 1]]) 
    eight_sector_3d = bottom.extrude(vectors * height, capping=True)

    return eight_sector_3d

def plot_deflector_with_subplots():
    """
    绘制八瓣静电偏转器的2D和3D视图
    """
    # 创建plotter
    pl = pv.Plotter(shape=(1, 2), window_size=(1200, 600))

    # 创建2D和3D模型
    eight_sector_2d = create_2d_eight_sector(radius_outer=0.5, radius_inner=0.4, gap=0.1)
    eight_sector_3d = create_3d_eight_sector_deflector(radius_outer=0.5, radius_inner=0.4, height=1.0, gap=0.1)

    # 2D视图
    pl.subplot(0, 0)
    pl.add_mesh(eight_sector_2d, color='cyan', show_edges=False)
    pl.camera_position = 'xy'
    pl.add_title("2D Eight Sector", font_size=10)

    # 3D视图
    pl.subplot(0, 1)
    pl.add_mesh(eight_sector_3d, color='cyan', show_edges=False, opacity=0.7)
    pl.camera_position = 'iso'
    pl.add_title("3D Eight Sector", font_size=10)

    # 为每个视图添加坐标轴
    for i in range(2):
        pl.subplot(0, i)
        pl.add_axes()
        pl.camera.zoom(1.2)

    pl.show()

if __name__ == "__main__":
    plot_deflector_with_subplots()

参考

  • https://docs.pyvista.org/api/core/filters
  • https://docs.pyvista.org/examples/01-filter/