突然发现,上次正儿八经使用Matplotlib还是17年在前,除代码还可查外,当时的笔记已不复存在。重新了解一下...
1 2 3 4 5 6 7 8 9 10 11 12 13 14 15 16 | |
8种Qt后端
在Python下,编写Qt程序,目前有4个绑定选项存在:
- PyQt6
- PySide6
- PyQt5
- PySide2
老版本的matplotlib还支持 PyQt和PySide,由于其对应的Qt4在2015年就停止支持,应该无需考虑。
而每个绑定,又有2个渲染后端可选择:
- Agg
- Cairo
选择Qt绑定的规则
Matplotlib是如何同时支持这四个的??官方手册是这么说的:
- If a binding's QtCore subpackage is already imported, that binding is selected (the order for the check is PyQt6, PySide6, PyQt5, PySide2).
- If the QT_API environment variable is set to one of "PyQt6", "PySide6", "PyQt5", "PySide2" (case-insensitive), that binding is selected. (See also the documentation on Environment variables.)
- Otherwise, the first available backend in the order PyQt6, PySide6, PyQt5, PySide2 is selected.
挺啰嗦,不如看代码直观:
1 2 3 4 5 6 7 8 9 10 11 12 13 14 15 16 | |
考虑到Qt5生命周期明年就结束了,我们可以只考虑PyQt6和 PySide6两兄弟,同时我也不喜欢设置环境变量QT_API,那么可以这么简单理解:
- 如果Python中只安装PyQt6或PySide6中一个,装哪个用哪个
- 如果同时装了2个,默认使用PyQt6,除非使用matplotlib前
import PySide6.QtCore
由于PyQt不支持LGPL协议,原则上,不管是否商用,只考虑PySide6就够了。如果要支持Windows7,可以考虑PySide2。
QtAgg 与 QtCairo
除了不同的Qt绑定外,它还有不同的渲染后端支持
- QtAgg:使用 Anti-Grain Geometry 这一个 C++ 库来渲染,适合需要快速渲染和交互的应用。
- QtCairo:使用 Cairo 库来渲染,提供更高质量的图形渲染,尤其在文本和矢量图形方面。速度慢。
默认使用的QtAgg后端,同样它有多种方式可以用来指定:
- 使用
rcParams["backend"]参数,通过代码,或者matplotlibrc文件 - 使用环境变量
MPLBACKEND - 使用函数
matplotlib.use()
Qt 控件对接
要在PySide6中使用 matplotlib,首要就是找到matplotlib提供的QWidget在哪里:
1 2 | |
上面两个都是QWidget的派生类:
- FigureCanvas 派生自 QWidget:源码
class FigureCanvasQT(FigureCanvasBase, QtWidgets.QWidget): - NavigationToolbar2QT 派生自 QToolBar:源码
class NavigationToolbar2QT(NavigationToolbar2, QtWidgets.QToolBar):
另外,不少matplotlib为主的例子中,会这么写:
1 | |
只是为了隐藏不同的Qt绑定的细节,对于库通用性有意义,应用程序中使用它意义不大。
Matplotlib 基本概念
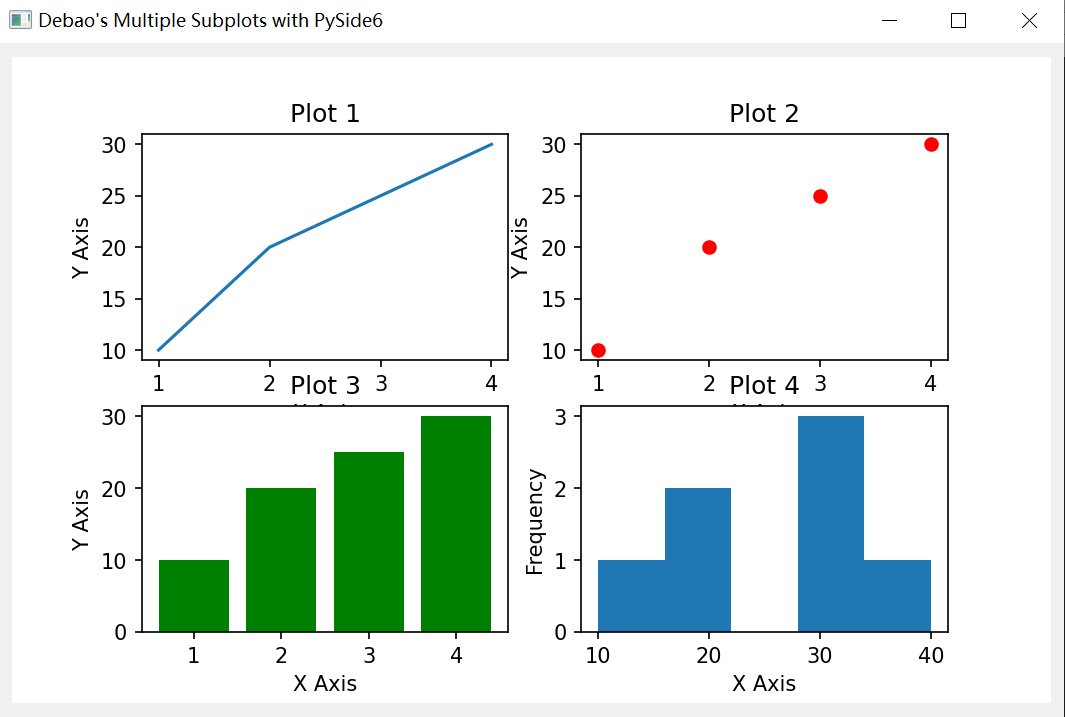
先看一张图:

- 图中有四个图表,每个叫做一个 Axes
- 四个 Axes 都位于同一个 Figure 中(Figure 是顶层容器)
- Figure 渲染到一个 QWidget 中(这个QWidget就是 FigureCanvas)
- PySide6 将这个 QWidget作为窗口显示出来
抛开FigureCanvas这种底层细节不说,Matplotlib中东西也挺多,一些主要的概念如下:
| 概念 | 作用 |
|---|---|
| Figure | Figure 是顶级容器,承载整个图形的所有元素,类似于空白画布,用来绘制可视化内容。 |
| Axes | Axes 是 Figure 中的矩形区域,提供坐标系,是绘制数据的地方,一个 Figure 可以包含多个 Axes。 |
| Axis | Axis 代表 x 轴和 y 轴,定义数据范围、刻度位置、刻度标签和坐标轴标签,控制刻度间距和定位。 |
| Marker | Marker 是表示单个数据点的符号,常用于散点图中区分不同的数据点,形状如圆形、方形、三角形等。 |
| Lines | Lines 连接数据点,通常用于折线图、带连接点的散点图等,表示数据点之间的关系或趋势。可自定义样式。 |
| Title | Title 是图形的描述性文本,通常显示在顶部,为可视化提供背景信息或数据描述。 |
| Axis Labels | Axis Labels 是描述 x 轴和 y 轴的文本,帮助理解数据及其单位或其他相关信息。 |
| Ticks | Ticks 是沿坐标轴的刻度标记,帮助用户理解图形的比例和数据位置。 |
| Tick Labels | Tick Labels 是刻度上的文本,显示与刻度对应的数据值,可以进行格式化或单位显示。 |
| Legend | Legend 是图例,解释图形中的符号或颜色,帮助用户理解不同数据系列或类别的含义。 |
| Grid Lines | Grid Lines 是辅助的横纵线,帮助用户更容易识别数据的模式或趋势。 |
| Spines | Spines 是围绕绘图区域的边框线,分隔图形区域与外部空间,可以进行自定义以改变边框的外观。 |
另外,关注 Artist 和 Patch,手册中有个类图
Matplotlib三种API接口(使用层次)
从易到难,Matplotlib 有三个使用层次:
| 接口层次 | 作用 | 特点 | 适用场景 |
|---|---|---|---|
| Scripting Layer | 提供简单的绘图接口,适合快速绘制常见图形,类似 MATLAB 风格。 | 简单、自动管理,快速绘图。 | 快速原型、常见绘图任务、日常数据可视化。 |
| Artist Layer | 提供对图形元素的精细控制,可以自定义图形的所有细节。 | 高度定制、灵活,直接控制图形对象的外观和行为。 | 复杂可视化任务、高度定制的绘图。 |
| Backend Layer | 控制图形的渲染和输出,决定如何显示或保存图形。 | 渲染图形到屏幕或文件,支持不同的图形工具包和设备。 | 图形文件输出、非交互式渲染、与图形工具包交互。 |
Scripting层/隐式pyplot接口
类似Matlab风格(好吧,因为太贵,我从没用过matlab),叫做octave风格?
1 2 3 4 5 6 7 | |
Artist层/显式Axes接口
按部就班,一层层构建
1 2 3 4 5 6 7 8 9 10 11 12 13 14 15 16 17 18 19 | |
Backend层
这个是我们最关注的,使用PySide6时,将Figure装进 FigureCanvas(一个QWidget)中,而后和Qt程序对接上了。
1 2 3 4 5 6 7 8 9 10 11 12 13 14 15 16 17 18 19 20 21 22 23 24 25 26 27 28 29 30 31 32 | |
Matplotlib 做什么?
数据可视化
Matplotlib 支持多种数据类型的可视化,包括但不限于:
- 配对数据 (Pairwise Data):使用散点图、成对关系图等展示数据点间的关系。
- 统计分布 (Statistical Distributions):通过直方图、密度图等展示数据的分布特性。
- 网格数据 (Gridded Data):使用热图、等高线图等展示规则网格上的数据。
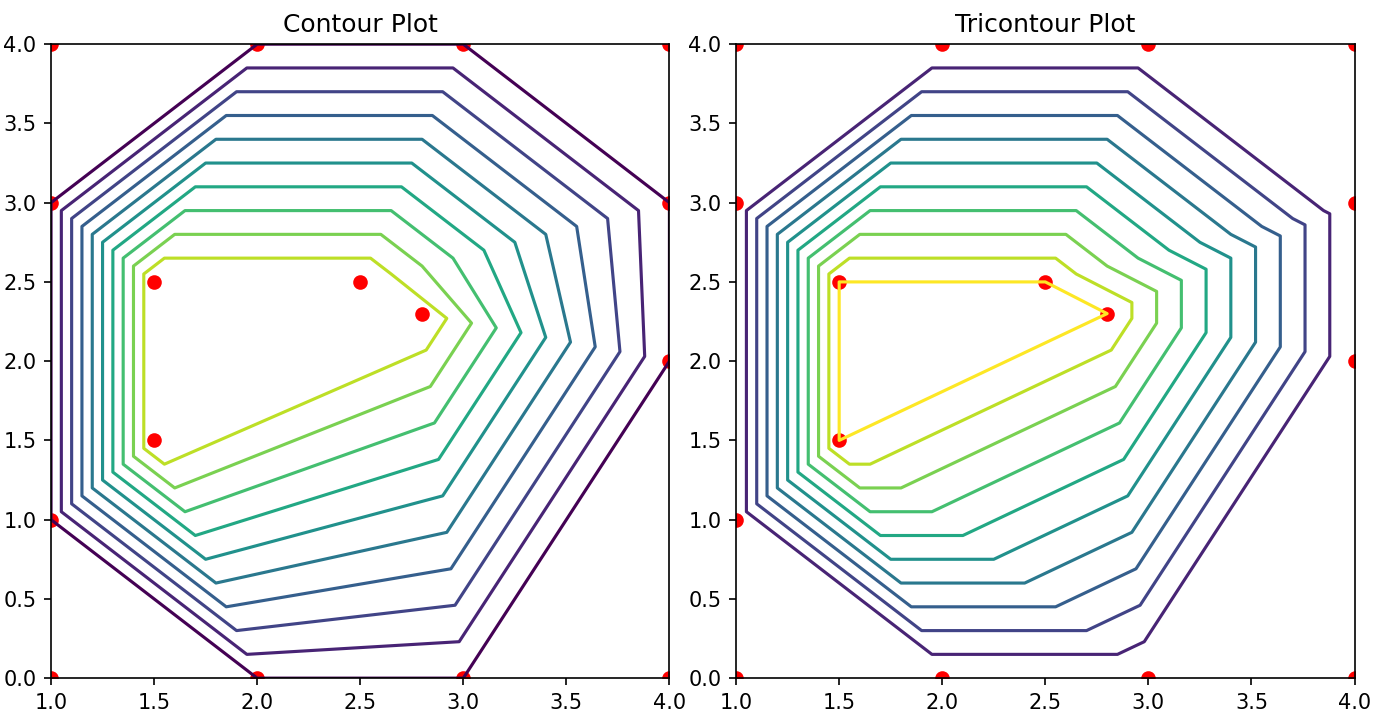
- 非规则网格数据 (Irregularly Gridded Data):通过散点图、三角网格图等展示不规则网格数据。
- 三维和体积数据 (3D and Volumetric Data):通过 3D 图、体积图等展示空间数据。
手册中有很直观的 Gallery 可以参考。
试着放个简单的例子,一组数据,应该是姿势不对,两种方式结果不同(似乎各有各的不准):

1 2 3 4 5 6 7 8 9 10 11 12 13 14 15 16 17 18 19 20 21 22 23 24 25 26 27 28 29 30 31 | |
键鼠事件
对于Qt后端,可以处理一些鼠标事件(尽管不强)
- https://matplotlib.org/stable/users/explain/figure/event_handling.html
动画支持
还有简单的动画支持
- https://matplotlib.org/stable/users/explain/animations/animations.html
参考
- https://matplotlib.org/stable/api/backend_qt_api.html
- https://matplotlib.org/stable/users/explain/figure/api_interfaces.html
- https://doc.qt.io/qtforpython-6/examples/example_external_matplotlib_widget_gaussian.html
- https://ajaytech.co/matplotlib/
- https://www.geeksforgeeks.org/python-introduction-matplotlib/
- https://matplotlib.org/stable/gallery/images_contours_and_fields/irregulardatagrid.html